SaaS Pharmaceutical Trial Analysis Platform
Visualizing and managing pharmaceutical trial data.
Challenge
Pharmaceutical trials generate an enormous amount of data, with thousands of samples to track, manage, and analyze. And for small research teams, the time and resources it takes to sift through that data mean extended timelines and delays in getting potentially life-saving drugs into the hands of those who need them. Our client, a global clinical research organization (CRO), had developed a SaaS product to tackle the challenge of interpreting and utilizing what is typically messy, disorganized data — but they needed some help developing a flexible framework that supported the various use cases of their customers.
Solution
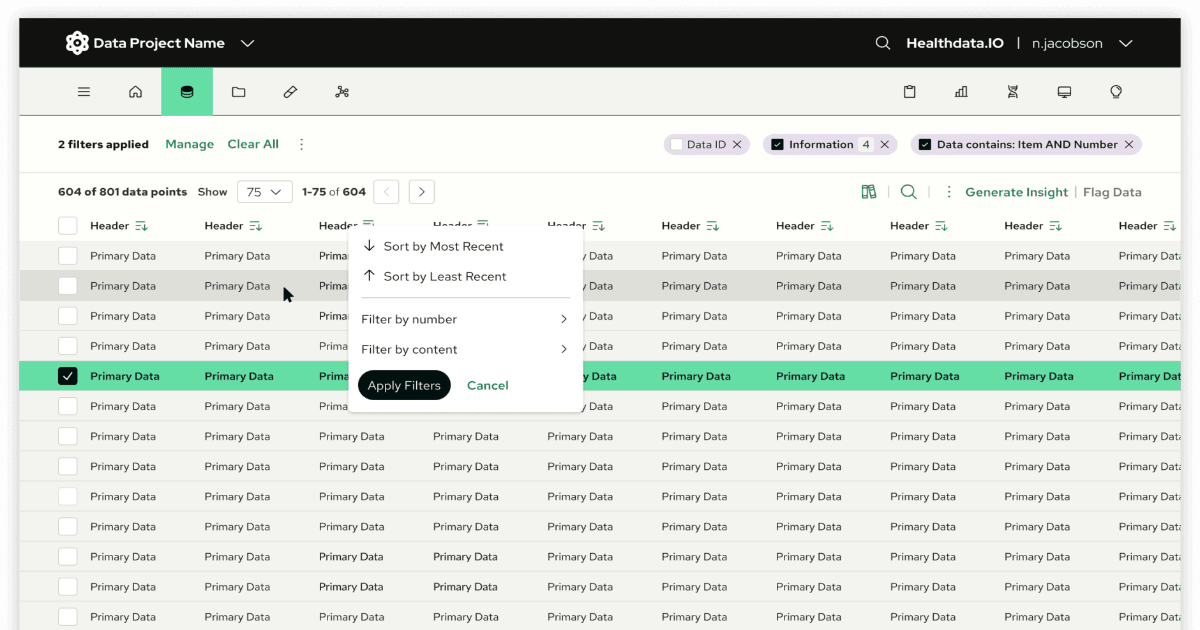
We created a robust solution that combines tabular data with complex, flexible data visualizations to connect disparate puzzle pieces and allow users to see the bigger picture. Our UX meets users where they are, whether they’re seasoned data scientists or a small team needing some help to fill a knowledge gap.
Results
We successfully addressed the challenges that users experienced with the v1 of the product, enhanced the overall ease of use and experience, and brought the product into alignment with best practices. Our solution measurably increased user empowerment, and made complex pharmaceutical trial data more manageable and accessible to a wider variety of clinical teams. Key results included: A 18% increase in user engagement post-launch. A 15% increase in self-reported user confidence and independence in data analysis. Increased support for a broader range of users, including those who did not consider themselves data scientists.