2024
Bitcoin History Data Processing
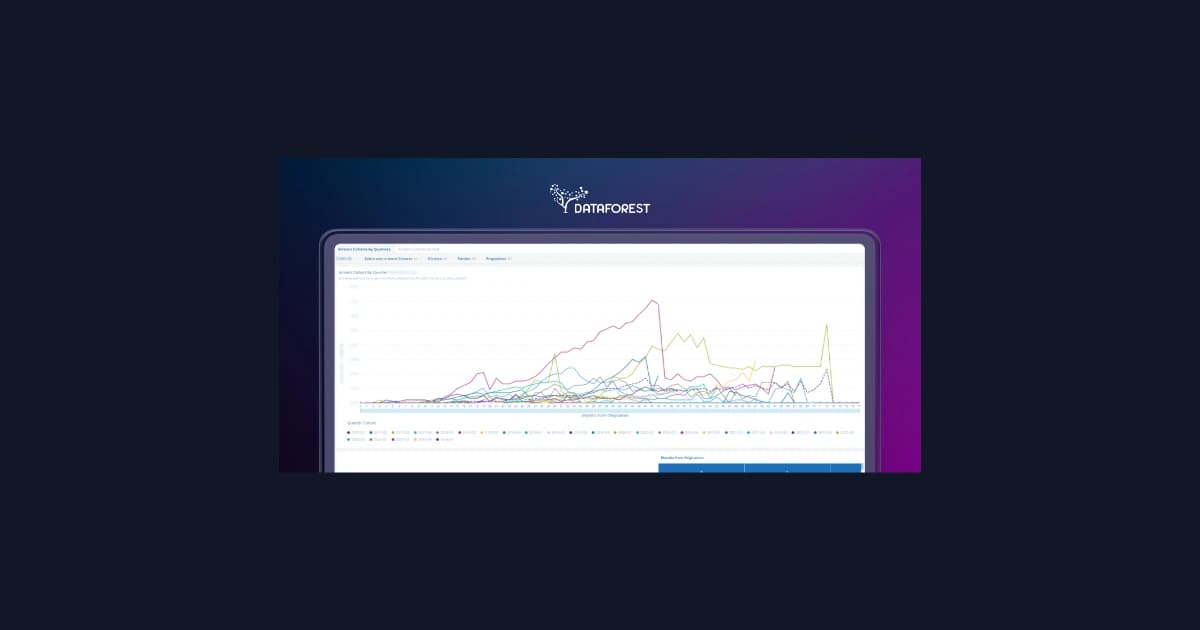
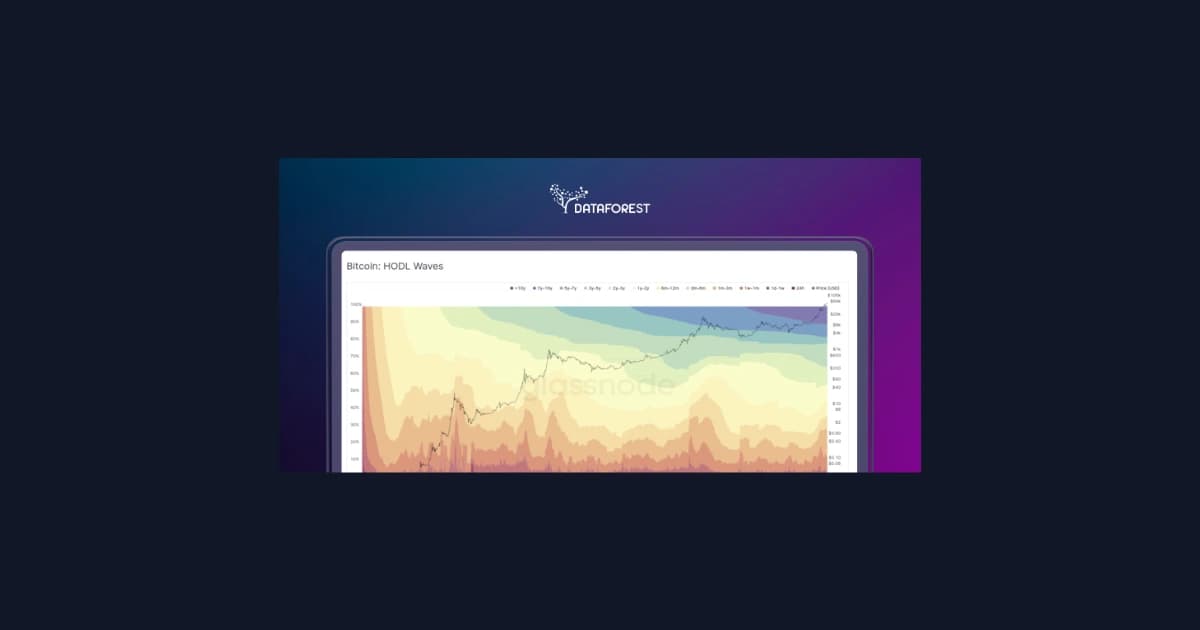
The client's leading service is various charts that visualize Bitcoin trading activities. The project consisted of migrating data from external providers into the client’s web solution and adding the full-time history of Bitcoin trading. The new and fresher data visualization services also played a part in developing the one web solution on the client’s infrastructure.
Challenge
* The project was built on a third-party provider system, which led to different problems with data processing speed and low data precision. Although the calculation of that amount of data costs a lot if using BigQuery * The metrics in this market are usually calculated only per 1 day, which complicates the calculation of historical data.
Solution
* The data was transferred to Databricks. Calculating metrics using BigData methods reduced the cost and duration of calculations, and the precision was at its highest point. * Dataforest developed a script that can calculate the size of each wallet and metrics in it for any period, which made it possible to use historical data and widen the charts and reports presision.
Results
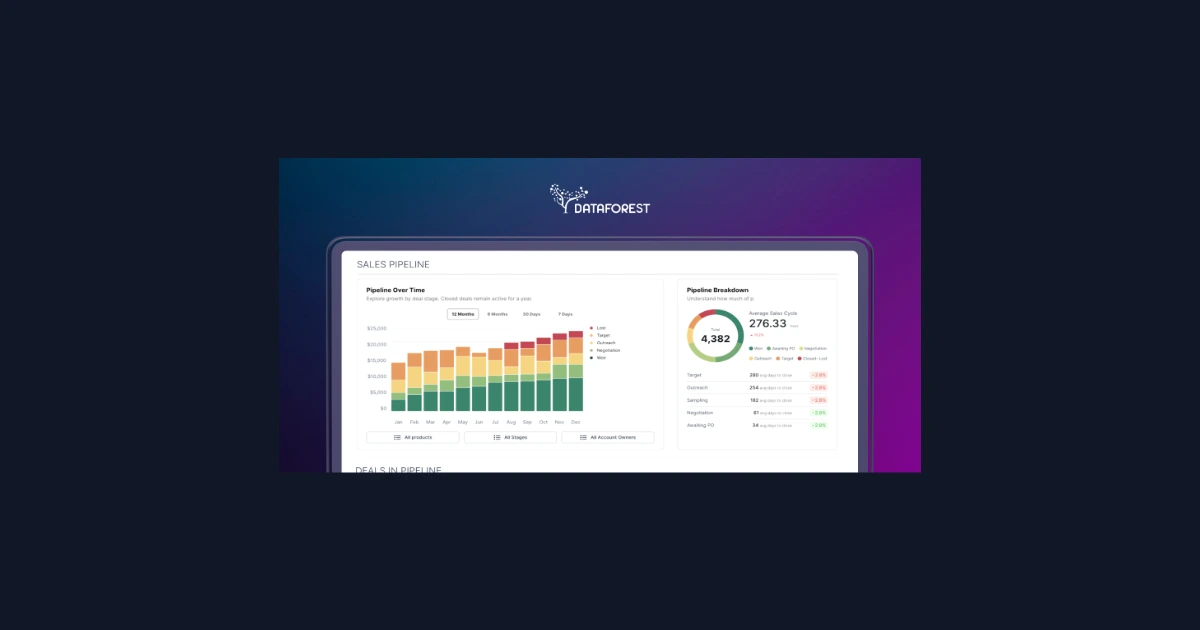
All the client's requests were fulfilled - the migration for their own infrastructure reduces the costs and provides the most precise data consolidation. New charts and reports were constructed in a modern style and were connected to the database alongside the daily metric calculations.
Technologies & Tools
PythonBigQueryPySparkDatabricks
Project Details
Year
2024
Duration
12
Budget
$50K – $100K
Team Size
7 people