IBM I Turning Five Years of Complex Business Data Into Visual System
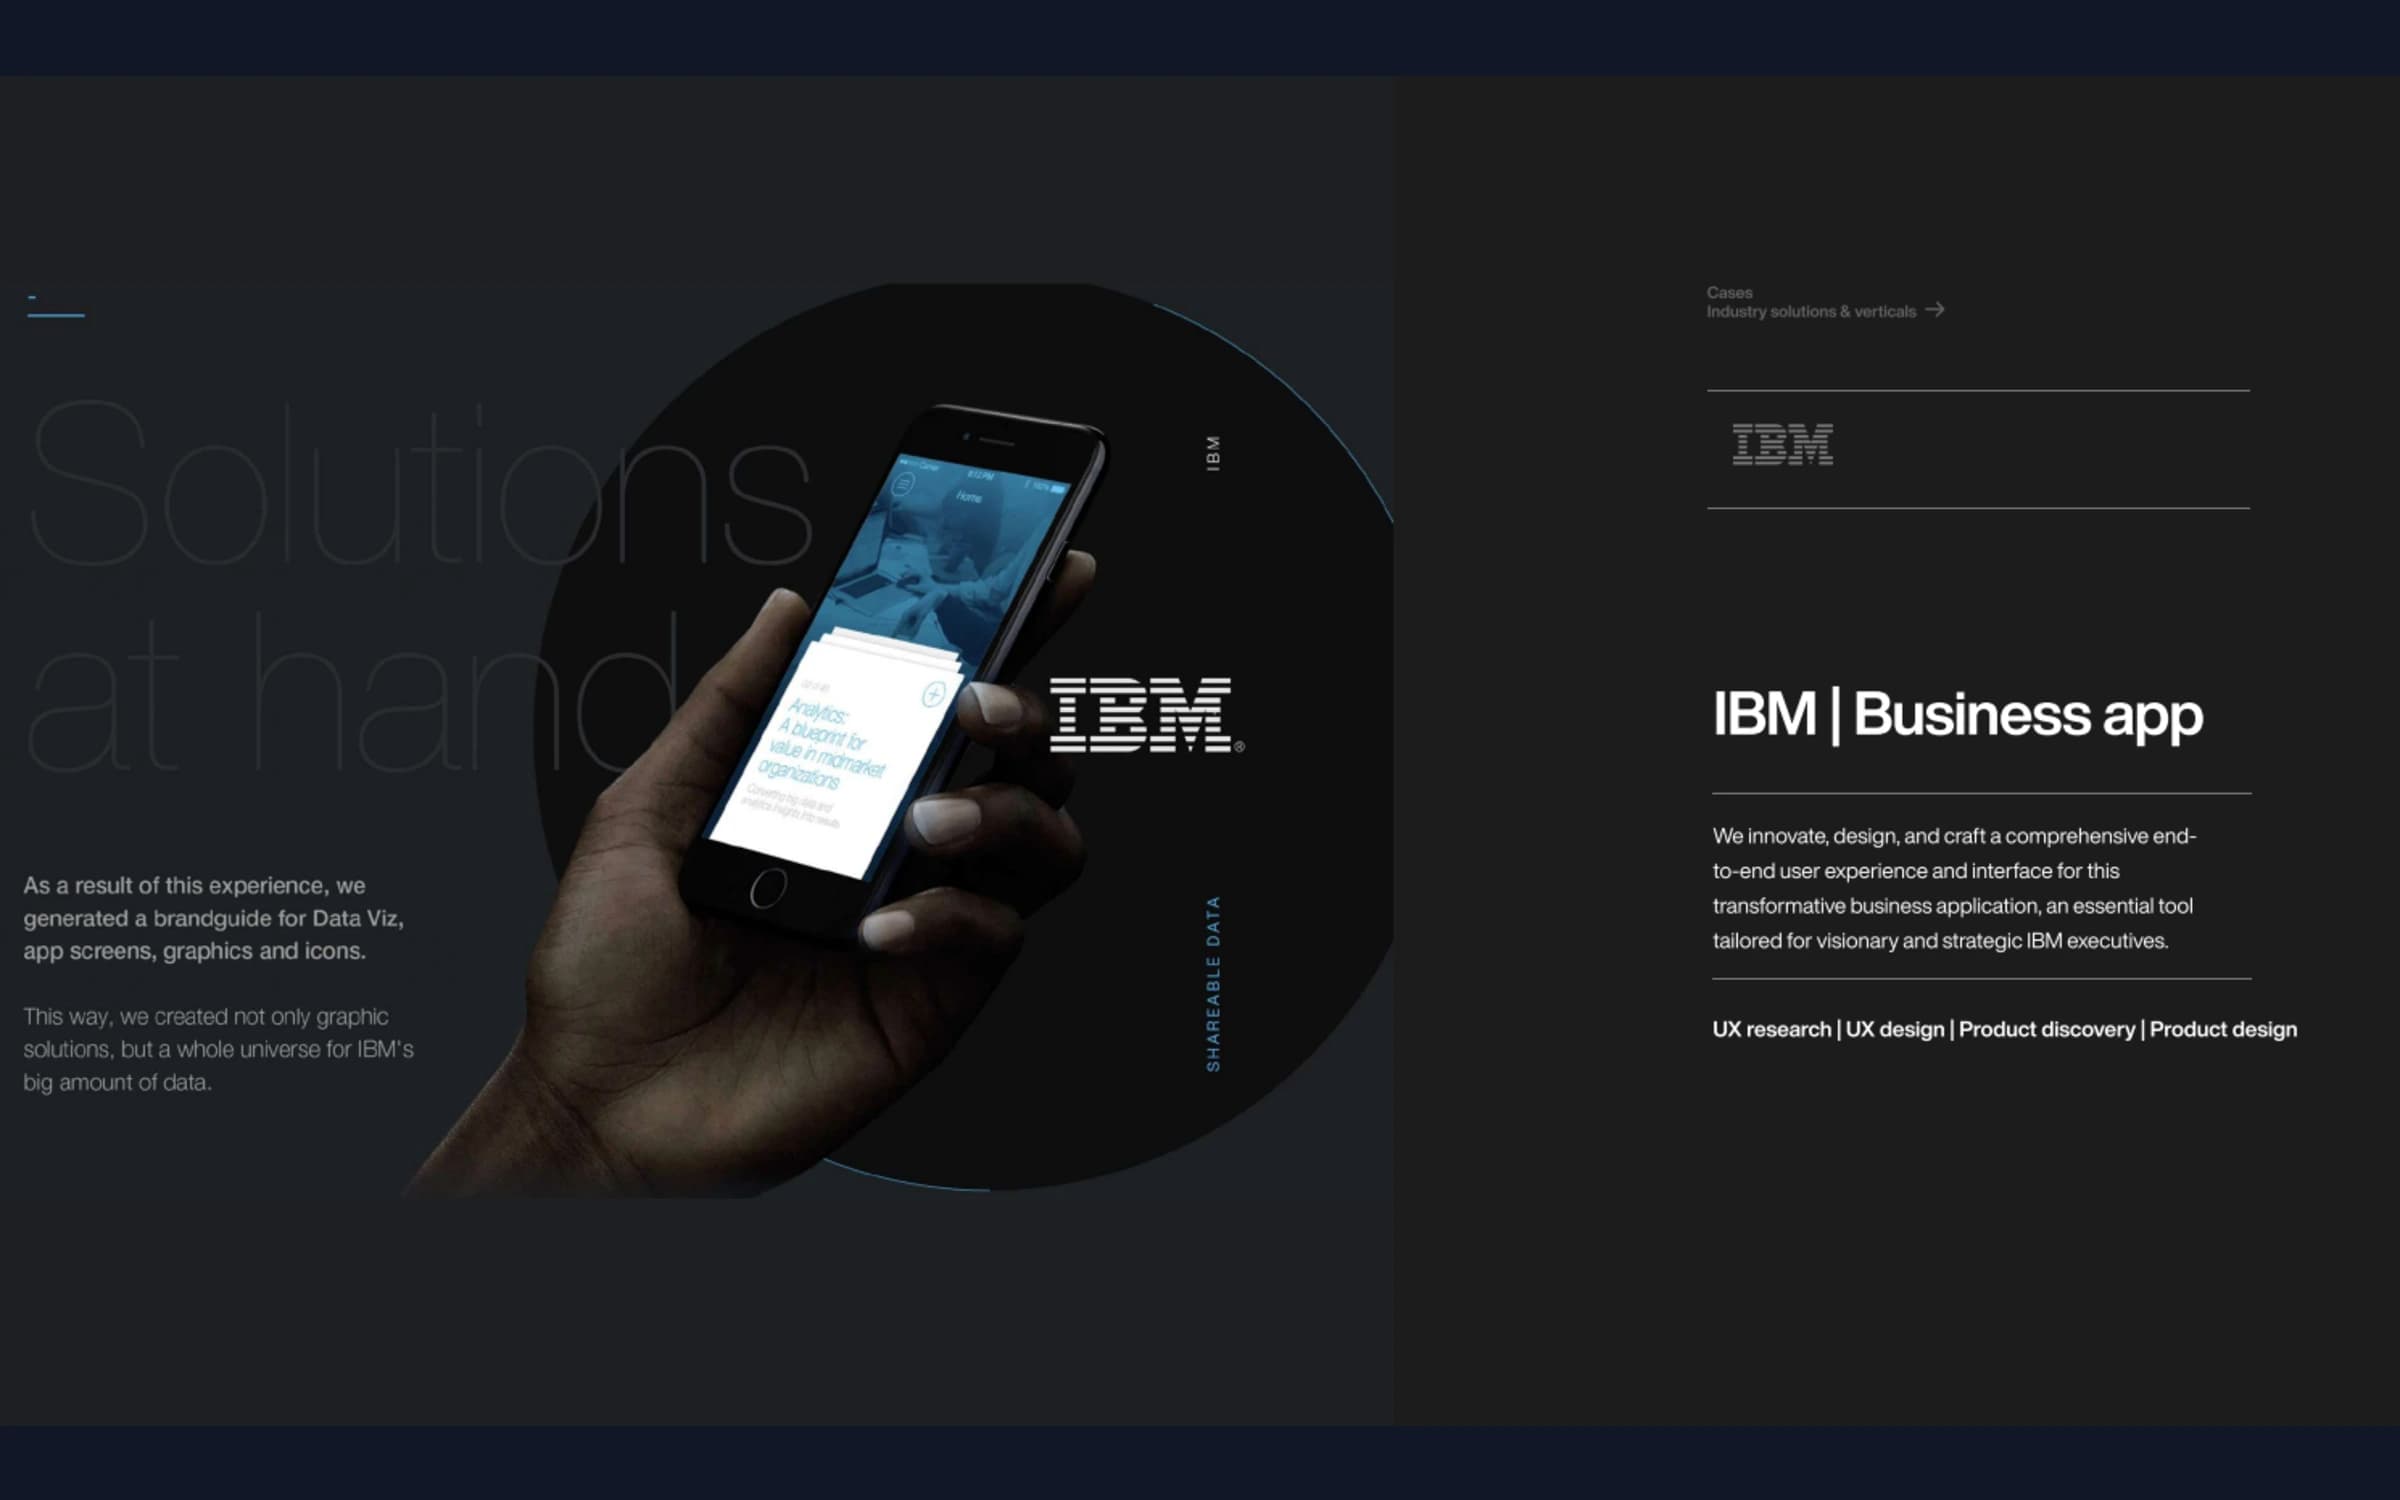
For more than five years, IBM has entrusted DHNN with the difficult task of processing and designing its business information in a way that is dynamic and relevant from static infographics used in press and business reports, to fully interactive data platforms.
Challenge
When a brand handles large volumes of data, the risk isn't a lack of information it's the opposite: overloaded charts, unclear hierarchy, and systems that don't scale to new use cases. IBM needed a visual language that was rigorous enough to stay on-brand and functional enough for teams to apply quickly across dozens of different data sets.
Solution
DHNN built this as a layered body of work rather than a single deliverable: illustrated infographics for recurring business reports and press materials; an interactive infographics platform for IBM US, including 3D animation and illustrated characters to present key business data dynamically; and an "environmental infographics" installation for IBM events, turning data into an interactive, room-scale experience through video, illustrated infographics and large-format data-viz murals.
Results
The relationship has continued for over five years, with IBM repeatedly returning to DHNN for new data storytelling formats a strong signal of trust for a company as risk-averse as IBM. This is a highly relevant case for any data-intensive prospect (Banking, Oil & Gas, Insurance) that needs to communicate complex information clearly, which is a challenge shared by all three of DHNN's core verticals.